Kathryn Napier, Cameron Neylon and Jamie Diprose
The Curtin Open Knowledge Initiative has just released a long awaited update to the Open Access dashboard. The migration from Microsoft Academic Graph (MAG) to OpenAlex is now complete. The (currently available) data for research outputs published in 2022 has also been released.
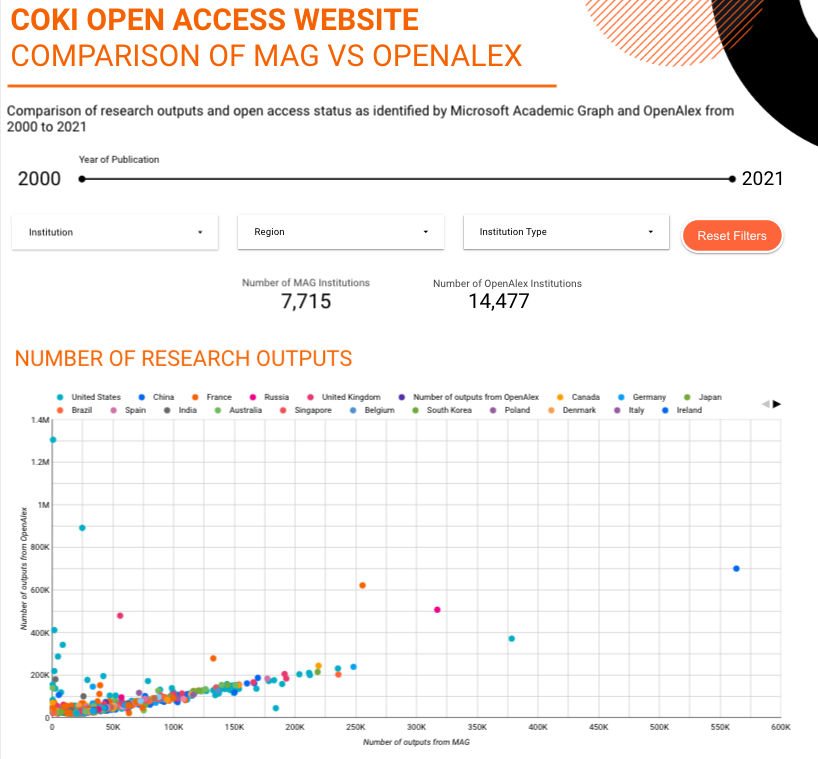
The Open Access dashboard provides information on the OA status of research outputs by country and by institution. At the core of this is assigning research outputs to institutions and MAG and now OpenAlex are our core source for this. The top level message is that OpenAlex is offering a big jump forward in coverage and completeness, and we know the team there are working hard on making it even better. Currently we’ve seen a huge improvement in the tracking of open access outputs in our dashboard, with 14,477 institutions covered, up from 7,715* previously.
The big good news story is the increase in the countries covered, with 221 now included, up from 189 previously. In particular this has seen a big increase in our coverage of African countries with an additional 7** countries now included, which is exciting given the inclusion of the COKI dashboard as a source on the AfricArXiv country pages.
There is a lot of detail to work through, and below we dig into the details. If you’re more keen to go straight to the data you can check out the main Open Access Website and we’ve set up a comparison dashboard that will allow you to compare the differences for your country or institution.
What is more (and what is less)?
Directly comparing the unique research outputs identified from MAG versus OpenAlex published between 2000 and 2021, we have increased the number of distinct research outputs identified by OpenAlex by ~28%* (see discussion below on how we identify research outputs), with an increase from 7,715* institutions originally included in the dashboard to 14,477 institutions identified by OpenAlex.
For the original 7,715 institutions included in the dashboard, 86% now have more research outputs identified with the move to OpenAlex. For those institutions (14%) with a decreased number of research outputs, the examples we have looked at suggest that this is largely down to a higher accuracy in affiliation assignment in OpenAlex vs MAG. For example, when investigating over 139,000 research outputs that were assigned to Boston Children’s Hospital by MAG but not by OpenAlex, almost 90% of these research outputs had raw affiliation strings for different institutions. A very small percentage (<0.6%) of these research outputs were also misassigned by OpenAlex, with research outputs mis-assigned to Boston Children’s Museum, Harvard University, and Children’s Hospital, among others.
At the country level, we have increased the number of countries or territories included in the Dashboard, increasing from 189 countries or territories identified by MAG to 221 countries or territories for OpenAlex. For the original 189 countries included in the dashboard, over 92% now have more research outputs identified with the move to OpenAlex, with only 15 countries having less research outputs identified.
What is different?
Parents and Children
One of the big challenges with assigning affiliations is that organisations have parts, and are parts of other organisations. Early on in our migration we noticed that OpenAlex appeared to be assigning a significant number of research outputs to child institutions, whereas MAG had been assigning them to parents. This is a classic problem in bibliometrics, for example where the question of whether a university associated hospital or institute is truly part of the university or a separate entity.
From a technical perspective “the assignment” in our system is defined by a ROR identifier. As noted above, we use OpenAlex as our core source of links between research outputs (DOIs) and organisations (RORs). Happily the ROR schema provides parent and child relationships and we use these to aggregate research outputs assigned to parts of institutions to their parent organisations. This works well because we don’t lose any granularity. For example, you can still look at London Business School, but we also get a better count of research outputs for the parent organisation of the University of London.
This has another important side effect which means that we’ve seen a massive increase in the research outputs assigned to collections of organisations. University consortia (like the University of California system) are now fully represented with all their component organisations contributing to an overall perspective. In addition governments, in their position as the parent organisations of national funding councils are also represented, with the Government of the United States now being the largest research organisation in the dataset (because it incorporates the research outputs of 33 child organisations such as the National Aeronautics and Space Administration, United States Department of Health and Human Services, and the facilities run by the National Science Foundation. Other ROR institution types such as “Healthcare” and “Facility” have also seen big jumps in the number of outputs.
Increase in the diversity of regional outputs
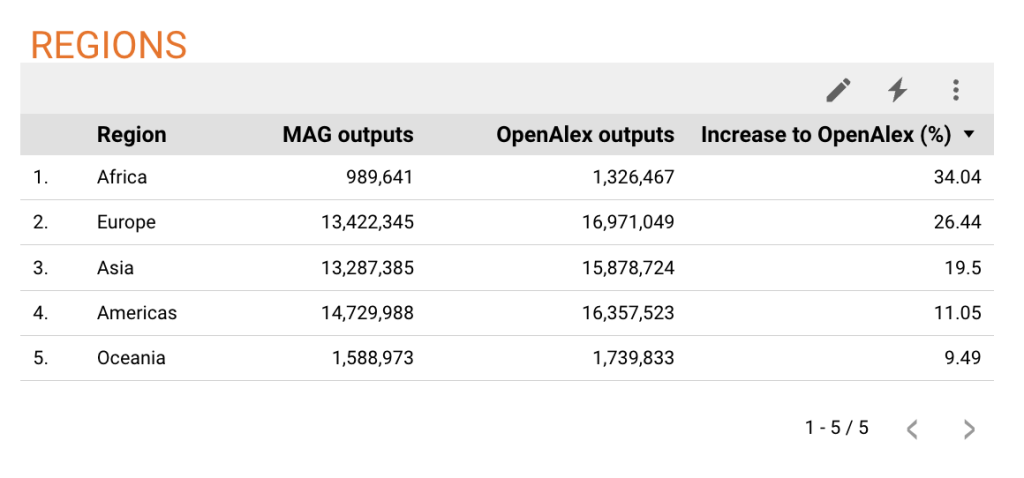
All regions demonstrated an increase in the number of research outputs with the move to OpenAlex, with Africa showing the largest increase (34%), contributing to the 16 additional African countries which we now include on the dashboard. African outputs also increase as a proportion of the total output volume from 2.2% to 2.5%. Other increases in the capture of regional outputs ranged from a 26.5% increase for Europe to 9.5% for Oceania. The overall proportions for other regions remain much the same with an increase for Oceania, a slight increase for Europe and a slight decrease for the Americas.*
What research outputs do we include?
Our base dataset is the set of outputs with Crossref DOIs. As OpenAlex includes a wider diversity of research output types compared to MAG, we now filter research outputs based on their Crossref Metadata type. The types we include in this process are journal articles, proceedings articles, reports, posted content, edited books, books, book chapters, book parts, book sections, reference books, monographs, reference entries, and other.
We exclude types such as datasets, databases, components, report components, peer reviews, grants, proceedings, journal issues, report series, book tracks, and any with a null type. This is to filter out multiple ‘containers’ for a research output, such as supplementary material for a journal article, or outputs such as datasets which we hope to tackle separately in the future (not least by including the broader range of datasets that are identified by DataCite DOIs and other PIDs).
Latest Features
We have also released a range of new features to the dashboard since our last blog post:
- You can filter countries or institutions by region or subregion, as well as open access percentage, total number of publications, total number of open publications and institution type.
- Each country and institution page now has a breakdown of Other Platform Open categories and the locations where Other Platform Open outputs are found.
- You can now easily share your country or institution to Twitter, Facebook or LinkedIn via the social sharing buttons on each country and institution page.
- When you share a link to a particular country or institution on social media, including Facebook, Twitter, LinkedIn and messaging apps, a summary card for the given country or institution is displayed.
- You can also download aggregated data for each country or institution as a comma-separated values (CSV) file directly from the dashboard.
What is next?
Important to note is that the next thing will be a return to a weekly update schedule for the Open Access website. This means that the numbers in this post will start to diverge from those on the website (slowly at first but this will increase over time). The linked comparison dashboard that supports this document will remain static, so those numbers should continue to match exactly.
Currently the dashboard includes 221 countries and territories (with at least 15 research outputs) and 14,477 institutions (including all 7,715* original institutions identified by Microsoft Academic Graph, and all other institutions identified by OpenAlex with at least 1000 research outputs). We will include even more institutions (that have less than 1000 outputs) in future updates to the dashboard once we have moved our backend to Cloudflare D1, a serverless SQL database.
We also want to fix some usability issues, for instance, when filtering, update the URL in the address bar to enable users to share filtered views of the dashboard and to fix backward browser navigation. In addition we aim to enable the embedding of a country or institution summary in a third-party website as well as add more flexible filtering options.
More broadly the decision to exclude datasets from this dashboard raises the question of how we might provide some useful tracking of data sharing. We also hold other data on institutions (and to some extent countries) which addresses some of the broader open knowledge objectives laid out in both the UNESCO Open Science Recommendation and the CoARA declaration. The current dashboard is focused on Open Access to formal research outputs but we are keen to work with the community on other useful forms of information summary that can help drive the broader open knowledge transition.
*Edit 31/08/2023: Blog post corrected to ‘7,715′ from ‘7701’.
**Edit 31/08/2023: Blog post corrected to ‘additional 7 countries’ from ’16’. 9 other African countries showed an increase in the number of years with outputs detected with the move to Open Alex.
Recent Comments